In my own surveys I conduct and analyze as well as outside ones, I always take for granted one thing: that respondents who see themselves as Independent but say they lean toward a certain party resemble generic partisans more than they do independents who don’t lean one way or another. This of course lies at the center of how political science approaches asking about people’s party affiliation. The common practice entails asking respondents to identify with seven (or sometimes five) partisanship groups for a precise but simple categorization scheme–as either “Strong Democrat,” “Weak Democrat,” Democratic-Leaning Independent,” “Pure Independent,” “Republican-Leaning Independent,” “Weak Republican,” and “Strong Republican” (this matches more how surveyors classify responses, as survey-takers don’t see these exact groups, e.g. pure or weak are usually not used in the actual questions).
A wealth of research has shown that Independents who lean toward a major party in fact express a political behavior that closely matches that of regular partisans (strong and weak ones). For example, Independents who lean Democrat vote for Democratic candidates and espouse Democratic issue positions at about the same rates as self-described Democrats do. Given this similarity, Independent leaners are often–but not always–grouped into the parties to which they lean during presentation of survey results (i.e. how question responses break down along party lines).
Notably, these findings help better understand the oft-reported but misleading statistic that Independents are the largest partisanship group. It appears here in a Gallup report, and I first encountered it in an introductory government college course–presented by the professor as a source of hope in a politically divided country. Of course, as political science research shows, many of these Independents act very much like partisans, and thus the fanfare about a plurality of political Independents is seriously misguided.
While I have read some of the literature on this topic, I wanted to test this assumption myself using data, both as a way to see how clear-cut this political finding is (i.e. for purposes of more or less replicating and extending) and considering how important it is to survey analysis. I turn to the American National Election Studies time series data for this, and to see how various measures of political behavior break down among each of the seven party ID groups mentioned above. Specifically, I’m aiming to see how different leaners are from weak and strong partisans, for both major parties.
To give some initial grounding, here is the distribution of partisanship among ANES respondents who said they voted, spanning election years since 1964.

The first impression this data should give off is the considerable stability in party affiliation of American voters over time. The chart below gives specific numbers on the changing partisanship composition.
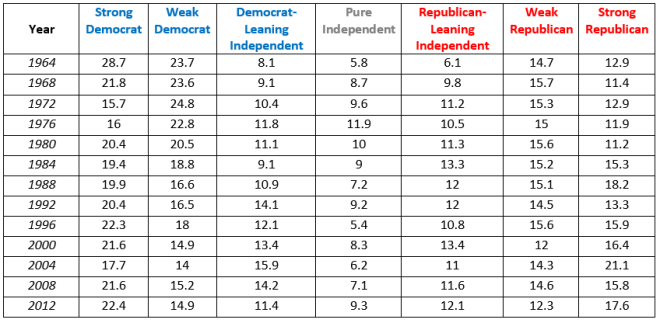
Through the last 50 years or so, the number of strong Democrats–declining from their high in 1964–have come much closer to the number of strong Republicans among those who vote. In general, the landscape of party affiliation–though very stable overall–has generally become more even: the two partisan Democrat groups decrease in percentage while the two partisan Republican groups increase a bit. Leaners for both parties steadily take up a larger share of the electorate over time, while unaffiliated (“pure”) Independents revolve around 10 percent to single digits.
Vote Choice
I first wanted to look at how different party identifiers broke down along the most basic and important of political behavior qualities: vote choice.

Strong partisans–among Democrats or Republicans–display the highest commitment to voting for their own party’s candidate. However, weak partisans and Independent leaners don’t trail too far behind, especially in more recent years. The average difference in percentage voting Democrat between strong Democrats and weak ones is 18.5 points; it’s a bit smaller between strong and leaner Democrats at 17.3 points. The disparity shrinks down to 12.3 for weak Democrats and 13.5 for leaners in elections since 2000. In the most recent election for which the ANES has data (2012), leaners were much closer to strong Democrats–a difference of 10.1 points in Democratic vote rate–than weak Democrats were–a difference of 15 points. To put it in different terms, 98.1 percent of strong Democrats voted for Obama in 2012, while 83.1 of weak Demcorats and 88 percent of Democratic leaners did. These leaners remain behind strong Democrats regarding party loyalty in vote choice, but both voted for Obama at high rates, and leaners proved more loyal to the party in 2012 than weak Democrats did.
A similar story appears on the other side of the aisle. The difference in Republican voting rates between strong Republicans and weak ones was an average of 14.7 points, and 15.6 points between strong Republicans and Independents who lean red. Defections to Ross Perot in the 1992 and 1996 elections made weak Republicans and leaners less loyal to the party; excluding these two years drops the difference two percentage points in each group (i.e. the two groups are more similar to strong Republicans). In elections from 2000 to 2012, weak Republicans in fact become more loyal to the party at the ballot box (9.1 difference from strong ones) while leaners stay about the same (15.8 difference). However, the difference is smaller for leaners (10.9 points) than for weak Republicans (11.3) in 2012. 96.9 percent of strong Republicans voted for Romney in 2012, while 86 percent of Republican leaners and 85.6 percent of weak Republicans did.
In sum, for both parties, Independent leaners are very similar to weak partisans in terms of vote choice tendency, and not far behind strong partisans in this measure. This type of close similarity offers solid support for grouping leaners, strong partisans, and weak ones when breaking down survey results by party. All three groups have similar vote choice inclinations. Most importantly, the leaners–made up of people who identify as Independent but when pushed reveal a bent toward a major party–are not all that different from self-described partisans.
The results for vote choice comparison should carry the most weight, but below I’ll quickly go through how other political measures break down across these seven partisanship levels.
Ideology

Political ideology–based on a seven-point spectrum narrowed down to three groups–of voters belonging to different partisanship groups reinforces the conclusion from the previous section: Independent leaners are generally similar to self-described partisans when looking at key political behavior measures. On average in election years from 1972 to 2012, 52 percent of strong Democrats described themselves as liberal, 39.2 percent of weak Democrats did, and 44.2 of Democratic-leaning Independents did. Democratic leaners were about as ideologically left-leaning as most self-described Democrats were. Strong Democrats have consistently grown more liberal compared to the other two groups–proving much more liberal in 2012 than at any point in this time frame–but ideology still remains similar between all these groups.
On the right-wing of the spectrum, all three Republican groups display much greater affinity to their primary ideological orientation–conservatism–than the Democratic groups do with theirs–liberalism. Regardless, ideology among the three Republican groups is similar to some degree. On average, 82.4 percent of strong Republicans saw themselves as conservative, 62.5 percent of weak Republicans did, and 62.4 percent of Republican-leaning Independents did. In this case, the strongest partisans on this side of the aisle are much more conservative than other segments of the party’s base (relative to the Democratic side). All three groups generally trend more conservative over time, though strong Republicans do so at a greater rate. Leaners resemble weak partisans more so in this case, but the point still stands that these Independents–who reveal a lean toward the Republican Party–are much more similar in ideology to generic Republican partisans than pure unaffiliated Independents are.
Government Spending

The above graph shows the average position on the issue of government spending among the six key groups (excluding pure Independents now). The issue ranged from the most liberal position, that “government should provide many more services/increase
spending a lot,” to the most conservative position, that “government should provide many fewer services/reduce spending a lot.” I coded the question so that it ranges from most liberal at a value of one to most conservative at a value of seven in the graph above.
Strong Democrats are more liberal on government spending and strong Republicans are more conservative on this issue relative to other partisans/leaners. Nevertheless, the Independent leaners match fairly closely the ideology of their respective lean parties, especially that of weak partisans. In election years from 1984 to 2012, strong Democrats average 3.03 on this ideological scale (where lower values mean more liberal), weak Democrats average 3.49, and Democratic-leaning Independents average 3.46. While the strongest partisans are furthest left on this issue, leaners are more liberal than weak partisans. In 2012, the value was 3.14 for strong Democrats, 3.74 for weak ones, and 3.64 for leaners. 2008 also shows that leaners became more liberal than weak Democrats relative to overall averages.
Strong Republicans average to a 4.93 ideological value over this time period (higher values mean more conservative), while both weak Republicans and Republican-leaning Independents average to a 4.55. In 2012, leaners became more conservative with a 5.34 value than weak Republicans did with a 5.02 value–leaners were closer to but still below strong Republicans at 5.49. In other words, leaners on the Republican side were quite ideologically close to regular partisans on the issue of government spending.
Abortion Rights

Shifting to a more social issue, positions on abortion rights reinforce some of the prior conclusions and add a new wrinkle as well. For this question about when abortion should be allowed, respondents had four different options, ranging from what I considered most liberal at a value of one to most conservative with a value of four (I reverse coded the original values to stay consistent with higher values meaning more conservative):
- By law, a woman should always be able to obtain an abortion as a matter of personal choice.
- The law should permit abortion for reasons other than rape, incest, or danger to the woman’s life, but only after the need for the abortion has been clearly established.
- The law should permit abortion only in case of rape, incest, or when the woman’s life is in danger.
- By law, abortion should never be permitted.
Unlike in the previous graphs concerning other measures of political behavior, Independents who lean Democratic are more liberal on the issue of abortion rights than regular self-described partisans in every quadrennial year from 1980 to 2012. On average–where lower values are more liberal on a 1-4 scale–these leaners place at 1.76, while strong Democrats are next most liberal at 2.00 with weak Democrats not too far behind at 2.01. All three groups more or less trend leftward on abortion rights over time. In 2012, leaners remain more liberal (1.51) than strong Democrats (1.66), who in turn have become more liberal than weak Democrats (1.76).
On the Republican side, those most attached to the party–strong Republicans–still remain more conservative on abortion than the other two groups. However, Independents who say they lean Republican aren’t too far behind on this issue in terms of a conservative outlook, and their positions follow very closely those of weak Republicans over time. On a scale from 1 to 4 where higher values indicates a more conservative position, strong Republicans average out to 2.50 from 1980 to 2012, while leaners average 2.22 and weak Republicans average 2.21. In 2012, strong partisans in this group were at 2.68, weak ones at 2.18, and leaners at 2.30. In other words, leaners place very much in line with other Republicans over time and most recently in 2012 on the issue of abortion rights.
Defense Spending

Finally, to include a more foreign policy-oriented issue (after previously examining economic and social ones), the above figure shows the issue placement of the six key groups on the question of defense spending. Answers ranged on a seven-point scale from what I considered most liberal–greatly decrease defense spending–at a value of one to most conservative–greatly increase defense defense spending–at a value of seven.
All three Democratic groups express very similar positions on the question of defense spending over time. In fact, on a scale where lower values relate to more liberal positions, Independents who lean Democratic average to a 3.72 value in election years from 1980 to 2012–more liberal than strong Democrats (3.80) and weak Democrats (3.92). This phenomenon is not as strong as with the abortion rights issue among Democrats, but still supports the notion of Independent Democratic-leaners falling well within the liberal mainstream–if not more attached to it. Most recently in 2012, leaners again prove more liberal (3.46) than strong Democrats (3.58) and weak Democrats (3.72) on the issue of defense spending.
In the Republicans group, strong partisans are much more conservative than others, but leaners remain fairly conservative and closer to positions of weak partisans. Strong Republicans average to 5.00 on this defense spending scale where higher values mean more conservative, while Independents who lean Republican average to 4.59 and weak Republicans to 4.54. In 2012, leaners (4.68) place ideologically closer to strong Republicans (4.89) than on the average level, with weak Republicans (4.53) further behind. All in all, Republican leaners match fairly closely with regular Republican partisans on the issue of defense spending.
Key Findings
Across all three of these different issue positions–in addition to vote choice and ideology–one thing becomes very clear: Independents who reveal an inclination to one of the major parties are not all that different from regular members of that party in terms of political behavior. Specifically for the issue positions analysis, one more interesting finding emerged: on the Democratic side, Independent leaners were sometimes more liberal than regular partisans and those with different strengths of attachment (strong vs. weak), and also sometimes less liberal. But on the Republican side, Independent leaners were consistently less conservative than than strong Republicans, and rather very closely matched with weak Republicans in terms of ideology. Relative to ideology on their respective sides of the aisle, Independents who lean Republican are more moderate than Independents who lean Democrat.
The caveat to the issue position examinations pertains to a selection problem: there’s a chance the three issues I chose are actually more aberrant and not as representative as I imply and want them to be. However, I doubt this is the case, in the sense that these represent prominent issues that span three different issue dimensions, and don’t deviate much from what examining vote choice and overall ideology indicate.
This is better suited for another post and analysis, but it’s worth briefly mentioning why Independents like this–who lean toward a party and are quite similar to regular party adherents–exist in considerable numbers. Eschewing party labels and self-descriptions stems from many voters’ distaste with the growing acrimony and gridlock between the two major parties. Expressing partisanship now carries with it socially undesirable connotations for many–whether in social or survey settings. As very interesting research by Samara Klar and Yanna Krupnikov shows, people often feel embarrassed to easily reveal their attachment to a party, and instead opt for saying they’re Independent to make a better impression. For example, in an experimental setting, exposure to partisan disagreement in Washington, D.C. in news stories significantly increased identification as Independent–a scenario that many Americans experience in everyday life. In the article linked above, Klar and Krupnikov say the following:
- “…our work points to the idea that “independent” has become a socially desirable label – one that conveys a sense of rising above the political pettiness in American politics.”
I think this idea of people wanting to rise above the pettiness of politics rings very true. The experiments the two authors conduct are most convincing for this, but anecdotally, I frequently observe this dynamic in people’s orientation toward politics. It might be more acute for me in terms of my current surroundings of younger Americans in college (and, after all, many of these Independent leaners likely trend younger in age), but I often see people become uncomfortable and put off by political discussion and American politics more broadly. It happens in social settings, in classrooms during discussions and lectures, and on online settings (e.g., Facebook). I’ve come to call it an “above the fray” attitude–the fray being political debate and disagreement. Very often it conveys sanctimony, but at the same time it’s hard to fault these people–and their disaffection–who’ve grown up in a political environment defined by rancor.
Regardless, the important point stands that while the number of self-identifying Independents have increased among the electorate and in the American public, many of these people reveal that they lean toward a certain party and in fact act in many ways like regular partisans. As the research I mentioned above discusses, this phenomenon has many different implications (e.g. damage done to political discourse and engagement), but one of them is not greater independence from party politics. Partisanship remains at one if its highest points in American political history and growing. You just have to ask Independents what side they lean to.

[…] large scale, quality datasets that make this possible, such as the American National Election Study that I’ve used often in the past, are only are released around every election year. The 2016 ANES data has […]
LikeLike
[…] Pro-Life Supporters… on Charting the Behavior of Leane… […]
LikeLike
[…] to a recent poll question, for example–usually use ungrouped party identification scales. As I’ve discussed in detail, this method of not grouping Independents with the party to which they lean creates a poor measure […]
LikeLike
[…] this offers a very deceptive picture of the partisanship of survey respondents (I explain why here). However, the “Republican % Net” variable I created should suffice as an adequate […]
LikeLike
[…] as a partisan can be seen as a socially undesirable response (more on this at the bottom of this post). This socially desirability bias has been understood to be stronger in live in-person interviews […]
LikeLike
[…] partisans in terms of voting proclivities, ideological self-identification, and issue positions, as I discuss in a past blog post. Given this evidence, I was curious in the decision Pew made in constructing a party ID weighting […]
LikeLike
[…] Does Approach to Cod… on Charting the Behavior of Leane… […]
LikeLike
[…] different from the voters in the party they lean toward. Independents who lean toward a party also tend to back that party at almost the same rate as openly partisan […]
LikeLike
[…] the voters in the party they lean toward. Independents who lean towards a celebration additionally tend to back that party at virtually the identical price as brazenly partisan […]
LikeLike
[…] the voters in the party they lean toward. Independents who lean towards a celebration additionally tend to back that party at nearly the identical charge as brazenly partisan […]
LikeLike
[…] different from the voters in the party they lean toward. Independents who lean toward a party also tend to back that party at almost the same rate as openly partisan […]
LikeLike
[…] the voters in the party they lean toward. Independents who lean towards a celebration additionally tend to back that party at nearly the identical price as brazenly partisan […]
LikeLike
[…] different from the voters in the party they lean toward. Independents who lean toward a party also tend to back that party at almost the same rate as openly partisan […]
LikeLike
[…] different from the voters in the party they lean toward. Independents who lean toward a party also tend to back that party at almost the same rate as openly partisan […]
LikeLike
[…] the voters in the party they lean toward. Independents who lean towards a celebration additionally tend to back that party at virtually the identical price as brazenly partisan […]
LikeLike
[…] different from the voters in the party they lean toward. Independents who lean toward a party also tend to back that party at almost the same rate as openly partisan […]
LikeLike
[…] different from the voters in the party they lean toward. Independents who lean toward a party also tend to back that party at almost the same rate as openly partisan […]
LikeLike
[…] different from the voters in the party they lean toward. Independents who lean toward a party also tend to back that party at almost the same rate as openly partisan […]
LikeLike
[…] from the citizens in the celebration they favor Independents who favor a celebration likewisetend to back that celebration at practically the very same rate as honestly partisan […]
LikeLike
[…] vers lequel ils se penchent . Les indépendants qui penchent également vers un parti ont tendance à soutenir ce parti à peu près au même rythme que les électeurs ouvertement partisans […]
LikeLike
[…] different from the voters in the party they lean toward. Independents who lean toward a party also tend to back that party at almost the same rate as openly partisan […]
LikeLike
[…] different from the voters in the party they lean toward. Independents who lean toward a party also tend to back that party at almost the same rate as openly partisan […]
LikeLike
[…] from the voters in the party they lean toward. Independents who lean toward a party also tend to back that party at almost the same rate as openly partisan […]
LikeLike
[…] within the occasion they lean towards. Independents who lean towards a celebration additionally are inclined to again that occasion at virtually the identical fee as overtly partisan […]
LikeLike
[…] different from the voters in the party they lean toward. Independents who lean toward a party also tend to back that party at almost the same rate as openly partisan […]
LikeLike
[…] from the voters in the party they lean toward. Independents who lean toward a party also tend to back that party at almost the same rate as openly partisan […]
LikeLike
There is NOT a wealth of research showing that leaners are closet partisans–just a couple of older studies cited repeatedly. And there IS research showing that leaners are different from weak partisans (eg. Fiorina, Unstable Majorities, ch. 6.
LikeLike
I think the behavioral and psychological trends from the ANES in the blog post make it clear how similar leaners are to strong/weak partisans though — ranging from more, less, and equally ideological than upfront partisan identifiers depending on the survey item. For the most recent data on vote choice, for example, co-partisan candidate support levels are indistinguishable across leaners vs. weak partisans.
LikeLike
[…] — which major party they would support if they had to choose, as voters who lean toward one party tend to vote for that party. Even with those responses incorporated, however, likely voters remained almost evenly divided: […]
LikeLike
[…] — which major party they would support if they had to choose, as voters who lean toward one party tend to vote for that party. Even with those responses incorporated, however, likely voters remained almost evenly divided: […]
LikeLike
[…] which major party they would support if they had to choose, as voters who lean toward one party tend to vote for that party. Even with those responses incorporated, however, likely voters remained almost evenly divided: […]
LikeLike
[…] — which major party they would support if they had to choose, as voters who lean toward one party tend to vote for that party. Even with those responses incorporated, however, likely voters remained almost evenly divided: […]
LikeLike
[…] — which major party they would support if they had to choose, as voters who lean toward one party tend to vote for that party. Even with those responses incorporated, however, likely voters remained almost evenly divided: […]
LikeLike
[…] — which major party they would support if they had to choose, as voters who lean toward one party tend to vote for that party. Even with those responses incorporated, however, likely voters remained almost evenly divided: […]
LikeLike
[…] — which major party they would support if they had to choose, as voters who lean toward one party tend to vote for that party. Even with those responses incorporated, however, likely voters remained almost evenly divided: […]
LikeLike
[…] — which major party they would support if they had to choose, as voters who lean toward one party tend to vote for that party. Even with those responses incorporated, however, likely voters remained almost evenly divided: […]
LikeLike
[…] — which major party they would support if they had to choose, as voters who lean toward one party tend to vote for that party. Even with those responses incorporated, however, likely voters remained almost evenly divided: […]
LikeLike
[…] they’d help in the event that they had to decide on, as voters who lean towards one occasion tend to vote for that party. Even with these responses included, nevertheless, possible voters remained nearly evenly divided: […]
LikeLike
[…] only matter insofar as they can sway vote choice, and research suggests that independent leaners vote for the party they lean toward at nearly the same rate as openly partisan […]
LikeLike
[…] only matter insofar as they can sway vote choice, and research suggests that independent leaners vote for the party they lean toward at nearly the same rate as openly partisan […]
LikeLike
[…] only matter insofar as they can sway vote choice, and research suggests that independent leaners vote for the party they lean toward at nearly the same rate as openly partisan […]
LikeLike
[…] only matter insofar as they can sway vote choice, and research suggests that independent leaners vote for the party they lean toward at nearly the same rate as openly partisan […]
LikeLike
[…] only matter insofar as they can sway vote choice, and research suggests that independent leaners vote for the party they lean toward at nearly the same rate as openly partisan […]
LikeLike
[…] only matter insofar as they can sway vote choice, and research suggests that independent leaners vote for the party they lean toward at nearly the same rate as openly partisan […]
LikeLike
[…] only matter insofar as they can sway vote choice, and research suggests that independent leaners vote for the party they lean toward at nearly the same rate as openly partisan […]
LikeLike
[…] only matter insofar as they can sway vote choice, and research suggests that independent leaners vote for the party they lean toward at nearly the same rate as openly partisan […]
LikeLike