The Key Demographics of Super Tuesday for the Democratic Primary

With Hillary Clinton capitalizing on her strongest advantages to rout Bernie Sanders in the South Carolina primary on Saturday night, the divides in demographic support for the two candidates have become further accentuated. Consistent with her strengths at the national level and in previous primaries and caucuses, the groups that carried Clinton to a decisive victory were African Americans and older voters.

The turnaround from the Palmetto State is quick, as the race now stands days removed from its first truly pivotal juncture: Super Tuesday, when 11 different states–as well as American Samoa, which somehow offers nearly half as many delegates as New Hampshire–will hold primaries or caucuses. 1,017 delegates will be up for grabs, all of which allocated proportionally–meaning “running up the scoreboard” or making a dent in a larger lead are just as important. By the end of Tuesday’s elections, 25.20 percent of pledged delegates will have been allocated; any sizable disparity that results afterwards will be difficult to overcome. With so much of this Democratic primary race already defined by varying characteristics in population, a closer look at the key demographics in the upcoming states is in order.

Using Morning Consult demographic data for the nationwide Democratic primary race polling, I identified three key demographic divides that define the support for either Clinton or Sanders: race, age, and ideology. In order to see how these traits may come into play next Tuesday, I looked at the demographic composition of each of the Super Tuesday state electorates based on exit poll data from the 2008 primaries. In order to match this data with current polling, the three key characteristics are black or white race, 18-29 age or 65+, and liberal/moderate/conservative ideology. While the 2008 demographics won’t identically parallel the ones that exist today (for example, the Democratic party is likely more liberal than before), it should nevertheless give a good picture of the electorates in these crucial future states–especially in light of so little polling in many of them.

super tuesday key demographic divide dem primary2-27
Sources: ABC News, New York Times, HuffPost Pollster, Real Clear Politics, FiveThirtyEight.

The most important takeaway from the table is the differential between each of these state’s demographic group percentages and the national average for these (the differences appear in color in the table, in the rows in which “Diff” follows a state abbreviation). Sky blue corresponds to an advantage for Sanders–a whiter/less black, younger, and more liberal electorate–and orange points to strong suits for Clinton–blacker, older, and more moderate/conservative voters (different shading more or less approximates degree of these strengths).

The extent of the strong points seen above for the candidates should all the while be mediated by the amount of delegates they gain from each state, which is included in the second-to-last column from the right. The final rightmost column depicts the current polling state of the race. Priority for the numbers here is granted in this order: HuffPost Pollster calculations that gives greater weight to more recent polls, Real Clear Politics averages or single polls, and FiveThirtyEight estimates/projections for level of support (specifically for the two caucus states in Colorado and Minnesota that contained the lowest amount of polling).

Restricting to the nine states with exit poll data from 2008, four could represent potentially strong ones for Sanders in terms of having a whiter/less black electorate than the national average. The first of these in Arkansas, however, trends away from liberalism and likely has an older electorate, thus partly explaining Clinton’s current strong standing there (the larger factor is of course her ties to the state). Massachusetts, Oklahoma, and Vermont are the friendliest to Sanders in terms of racial composition, as are Minnesota and Colorado: although no reliable polling data exists for these two caucus states, their general population (but not electorate) demographics–whiter and less black than the national average–offers at least some indicator that they would favor Sanders.

These states are crucial for Sanders, but even if he wins them, Super Tuesday results will likely not prove promising. The five other states reside in the south where Sanders will struggle most–where the electorate trends blacker and less liberal–and consequently where he faces polling deficits of 20 percentage points or more. Virginia, Tennessee, and perhaps Georgia might give Sanders his best chance to salvage some delegates. Nevertheless, his post-Super Tuesday path looks bleak; if he wants to change that outlook, between now and Tuesday is the most critical time for some race-altering event to occur.

The Key Demographics of Super Tuesday for the Democratic Primary

How Have Past Dropouts Affected Remaining Candidates’ Support?

Having at started with a clustered 17-person field, the 2016 GOP primary has seen candidates drop out of the race in four of the past six months, with each departure reshaping the prospects for election outcomes and the nomination. The winnowing process in 2015-16  has accordingly been much more prolonged than in the past, making for a very different race–and distribution of support–with a field of 15 candidates than a field of three or five. Most importantly, amid the wide ideological range that characterizes the modern day Republican Party, support behind a dropped-out candidate won’t be equally distributed across all the remaining ones, or go to the frontrunner necessarily, but instead maybe gravitate towards the most ideologically similar one remaining.

Regardless, three candidates have now dropped out after Iowa, three after New Hampshire, and one after South Carolina. A few more of the remaining pool are bound to exit as well, especially as the pressure to find an alternative to Donald Trump–for which the GOP establishment is quickly running out of time–ramps up as we approach Super Tuesday.

In that vein, I looked back at past GOP candidate dropouts during this election cycle to see how they affected the race. In the chart below, I average the polls–for each five candidates remaining–for the week before a past contender dropped out, the week after that decision, and what the change was. The bottom row shows the average effect of each dropout on the five candidates’ support.

A few notes: 1) Rick Santorum and Rand Paul dropped out on the same day, so they’re included in the same set of three rows; the same goes for Carly Fiorina and Chris Christie, whose pre- and post- dropout weeks overlap. 2) No polling has come out after Jeb Bush’s exit, so he’s not included, and neither is Jim Gilmore, for what I’ll call too little polling about him. 3) The averages come from polls entirely before or after the dropout date. 4) The top of the chart of course doesn’t include other candidates who likely benefited from early dropouts, but dropped out later on.

1
Source: RealClearPolitics and HuffPost Pollster.

First off, several potential confounds abound. Namely, the election results in February could have greater effects on candidate support rather than the redistribution of other support once tied to now dropped-out candidates. Other events might also have exerted greater influence, and perhaps account for the larger net changes seen above. Nevertheless, the short time spans involved here should capture the immediate changes in the race–and not be as influenced by other significant events. The averages in particular offer the clearest answer to the question at hand.

Across the eight different points at which a GOP candidate or two has exited the race, Marco Rubio has benefited the most from fellow contenders’ departures–but not by too much, as is the case with the other four remaining candidates. Especially as of late, he began to receiver larger bumps, but that stopped after the New Hampshire election. While he has risen in public support since September, the type of Republican party coalescence around one candidate needed for him to win–and which occurs so often in primaries–has not been that evident in where a dropped out candidate’s support has gone. That coalescence seemed likely earlier on in the election cycle, and now seems more definitive–the rank and file of the party now just have to follow suit.

Ben Carson experienced the largest polling percentage point loss, but that comes amid a broader decline. Next is Trump in terms of losses, but he still stays in the 30s range throughout this time period–as expected for a contender with a high floor but low ceiling.

Overall, dropouts have not made that much of an effect on the remaining contenders’ support. That, however, will certainly change in the near future, as more candidates will drop out with higher polling percentages and leave a smaller field to receive their support–that begins in earnest with Bush’s exit.


How Have Past Dropouts Affected Remaining Candidates’ Support?

Charting the Predictiveness of Early State Polling

Throughout 2015 in the political world, attention towards the polling positions of presidential candidates reached unforeseen heights. As poll numbers increasingly defined a candidate’s strength and dictated access to a national platform in debate stages, discussion over the meaning of these horse race numbers–and namely their predictiveness–grew as well.

Messages from the data journalism and political science community rightfully warned against placing too much stock in primary polling, which has a long history of instability as presidential races unfold. An entire Twitter account was dedicated to showing where primary leaders from recent elections stood at certain dates, ultimately revealing for most of 2015 the lack of predictive power primary polling held. For example, one day–even in later parts of the year–you might have stumbled on leads by Newt Gingrich in 2012, Rudy Giuliani in 2008, Hillary Clinton in 2008, and Wesley Clark/Howard Dean in 2004.

The point is that primary polling is notoriously variable, thus implying the excessive obsession on polling leaders on a given day as misguided. A more expansive analysis into prior decades of elections would certainly bear this out as well.

At the same time, the caveat to this general dismissal of primary polls conveyed that the closer one gets to election dates, the more accurate the polling measurements become.

Though it might be early for any retrospection considering the Democratic and Republican primary elections have only just begun, it’s still worth looking back at how predictive polls were with the results of the Iowa caucus and New Hampshire primary in hand.

Below I plot the correlation coefficient between monthly polling averages for the GOP side only and eventual percentages of the vote in each of the state’s elections for each month stretching back to the start of 2015, thus giving an indication of the predictive power of polls at each stage in the election cycle.

3.PNG
Source: HuffPost Pollster, New York Times.
2
Source: HuffPost Pollster, New York Times.

As can be clearly seen, the predictiveness of polling adheres to the idea of proximity to election dates as determining how closely they can predict eventual results. Polls in both states more closely mirror the final vote the closer they get to their respective election dates. Iowa Caucus surveys demonstrate this particularly well: while all over the place for the first five months of 2015, polls in the state gradually rise in predictive power before they reach their single-peak, high-water mark in the final eight weeks before the caucus.

Perhaps the most striking result from here is the stability of New Hampshire’s vote as expressed in public opinion polling, beginning as early as July of last year, and attaining a strong correlation to the final outcome for all months thereafter. This may have been an abnormally high predictive year for polls in New Hampshire, but even then, the principle about primary polls–specifically those regarding the early election states, and during the year before the elections–still stands: the closer you get, the more predictive you’ll find your polls.

2/14/15 Note: If compared with the run-up to past primaries, this will likely show a much higher correlation earlier on in the campaign. This almost certainly results from the abnormal context of the GOP primary in which at one point 17 candidates were in the race. Many of these on the lower end of public opinion support consistently remained there and thus closely mirrored their election day outcomes. This group (think Jim Gilmore, Mike Huckabee, Rick Santorum, George Pataki, etc.) overrepresents the overall field, and consequently produced a much stronger monthly correlation to eventual results than if only the candidates with the highest polling numbers were examined. Nevertheless, especially in New Hampshire with Trump and the candidates in the establishment lane, the stability explained above is still properly reflective of polling predictiveness. 

Charting the Predictiveness of Early State Polling

The Effects of Media Coverage on the 2016 GOP Race: Before and After Iowa

In one of the defining qualities of this current 2016 GOP primary race, Donald Trump has completely dominated media coverage since the announcement of his candidacy in mid-June of 2015. This dynamic has translated to a strongly compelling reason for explaining Trump’s public opinion rise, as his candidacy and positions have constantly been made salient in the minds of GOP voters, a result that, due to the congested nature of the GOP field, has become amplified even more so.

John Sides at The Monkey Cage was one of the earliest adopters of this idea that media attention has fueled Trump’s support, revealing the strong positive relationship between coverage and poll support, and stressed this effect starting in the summer and through the fall of last year. Nate Silver brought this issue of the inseparability between media coverage of Trump and his polling strength to the fore as well. Echelon Insights also introduced an interesting “Trumpometer” that once again emphasized the importance of media in Trump’s level of support.

At the same, if Trump at any point saw a decline in media coverage–as so many other candidates typically do, and increasingly so as we get closer to actual elections when attention tends to be more evenly distributed–then a dip in polling support would coincide.

That level of unprecedented media coverage for the most part lasted well into the Iowa caucuses on February 1st. As Ted Cruz and Marco Rubio came away from this date with some sense of victory and increased media awareness, the aftermath of this first juncture of voting–and up through the New Hampshire primary on February 9th–should test the theory of media spurring Trump’s high polling numbers.

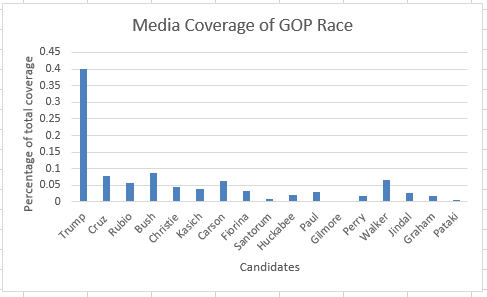
I found NewsLibrary.com, which can track news from American newspapers and television stations across certain periods of time, to be useful as a proxy for media coverage of presidential candidates (as defined by mention of their names in the lead/first paragraph of articles). From June of 2015 to the end of January 2016, the below graph demonstrates the lopsided distribution of media coverage of Republican candidates:

1
Source: NewsLibrary.com.

Comparing percentage of total candidate coverage with polling numbers by month reveals a 0.75 correlation for Trump in these categories, thus showing how critical the media has been to his public opinion support.

The week leading up to the caucuses, which could have presumably altered the tides in media coverage, did not detract much from attention towards Trump, though he did only earn about three times as much coverage as Ted Cruz in terms of total raw news (not as a percentage of all candidates).

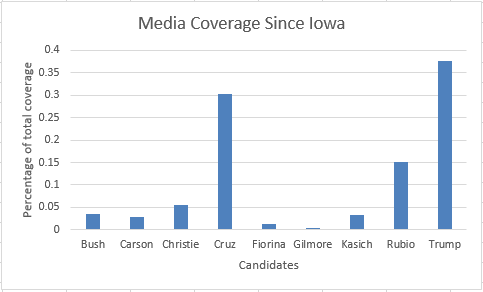
Since the caucuses (February 2nd through about noon today), however, media coverage–at least relative to where it stood before–has endured a dramatic shift, as seen below:

2
Source: NewsLibrary.com.

A poor outcome in the Iowa caucuses relative to expectations coming in has very noticeably cut into media attention towards Trump. Cruz comes close to matching the coverage of the businessman, and Rubio has received more attention as well.

One might have expected a greater share of coverage for Rubio, who in outperforming expectations, left the Hawkeye State as essentially a victor. This measure of course marks just one source for news hits, and perhaps metrics for cable news coverage would reveal a more favorable change for Rubio.

Yet I still believe this might undercut the bounce he gets coming out of Iowa. More importantly, if the race in New Hampshire were to really change, this media coverage development would have to work in Rubio’s favor most; while Cruz saw the greatest boost coming out of Iowa, he has a fairly low ceiling in a state like New Hampshire that has much less of a religious presence a more moderate Republican base. Thus, the shifting balance of media coverage seems to have availed Rubio–the candidate with the best chance at overthrowing Trump in the Granite State–only moderately.

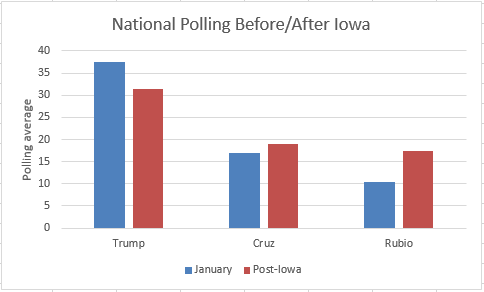
More polls over the next few days before the primary will offer a clearer picture, but here’s how the national race has changed going from the month of January to five days after the Iowa caucus:

3
Source: HuffPost Pollster.

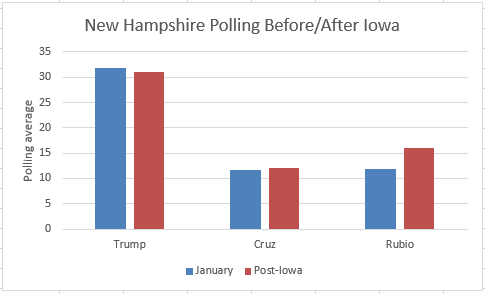
And how the New Hampshire race has changed within the same time periods:

4
Source: HuffPost Pollster.

At the national level, Trump has taken a six-percentage point hit, Cruz has improved by a little over two, and most notably, Rubio experienced nearly a seven-point increase in polling strength. Note that this averages across only three polls, but this still likely captures the post-Iowa changes well.

Perhaps part of the noted bandwagon effect behind support for the Trump campaign may be starting to materialize.

Yet the New Hampshire race does not reflect this, or at least not yet. Trump and Cruz hardly changed their standings at all, while Rubio jumped just over four percentage points. For a little while this week, it seemed like Trump’s polling numbers began to creep back to the high 20’s, but the latest polls for New Hampshire–showing Trump at 34 and 35 percent–restored his greater polling cushion.

Weighted polling averages from FiveThirtyEight show a slightly larger post-Iowa bounce for Rubio; with days remaining before the New Hampshire primary, though, this may not have been enough for Rubio to really complete a comeback in the state.

The Effects of Media Coverage on the 2016 GOP Race: Before and After Iowa