Recently, I was talking with someone about the relation between the Electoral College and voter turnout. Following an election in which the candidate who received plurality support did not become president, questions over whether the Electoral College best decides U.S. elections have surfaced in full force. The concern also coincides with another normative dilemma–the fact that only about three in five eligible Americans vote in elections. Perhaps, the thinking goes, the Electoral College disincentivizes participation in less competitive states. If one lives in a very blue- or red-leaning state, it makes little sense to think that a single vote will count much–compared to living in a more competitive swing state.
This sounded like a plausible idea, so I wanted to see what data in this past election and in prior ones had to say about this theory. In the below graph, I plot state competitiveness on the x-axis against state turnout on the y-axis. I define competitiveness as how close the margin between the two major party candidates–Hillary Clinton and Donald Trump–is by taking the absolute value of their difference in percentage support:
- Competitiveness = | (Clinton vote % – Trump vote %) |
I use state turnout measures from the U.S. Election Project Website. Among the different turnout rates listed, I use the Voting Eligible Population (VEP) Highest Office rate, as this appears for every state (unlike the Total Ballots Counted rate).
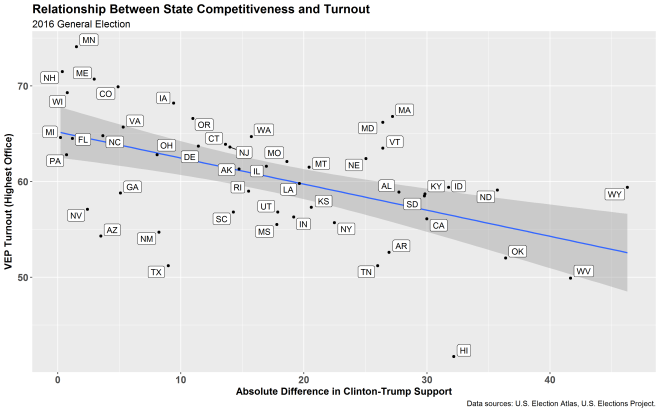
Although not extremely related, there exists a moderately strong relationship between state competitiveness and turnout in the 2016 election. In states that were decided by closer margins and thus were more competitive, turnout typically proved higher. I overlay a smoothed linear model to capture the negative association between difference in candidate margins and turnout. States like Michigan, Florida, and North Carolina, which were closely contested and had fairly high turnout, fall right on this line. But again, the relationship is far from perfect.
To gauge how common this pattern has been in American elections, I plotted the same variables over the last five elections. That’s what the below grids illustrate, along with correlation coefficients between these two measures for each election year:
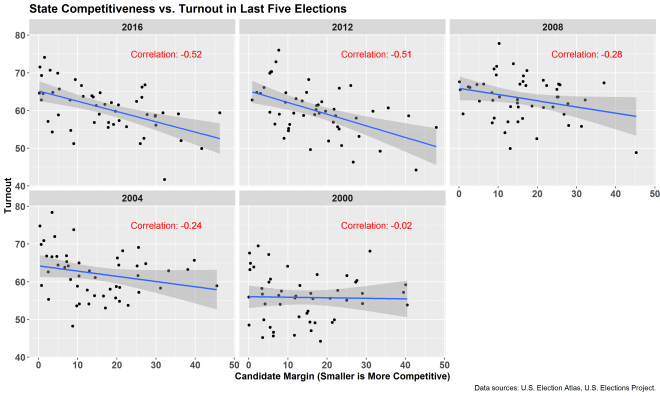
It appears that the strength between competitiveness and turnout only began to materialize in the last few elections. In the 2000 election, for example, there was essentially no relationship (correlation of -0.02) between how close a state was and voter turnout. The association grew a bit in 2004, which saw a -0.24 correlation between the two variables, and in 2008 with a -0.28. However, it’s been the 2012 election (-0.51 correlation) and the 2016 election (-0.52 correlation) in which competitiveness and turnout have become much more tightly linked. This is of course bivariate analysis that leaves out plenty of other factors that could influence turnout, but there seems to be some credence to the aforementioned theory: close battleground states generally produce higher turnout among their eligible citizens, while staunchly Democratic or Republican states see their voters stay home on Election Day more often.
There’s a chance this analysis would make more sense by incorporating a lag for state competitiveness. In other words, it seems more theoretically sound that voters would view closeness in their state’s last election, and on that account decide whether to participate in the current election. I tested this possibility (e.g. connection between 2016 turnout and 2012 competitiveness at the state level), but found the relationship was generally weaker than when comparing the variables within the same election year.

[…] Competitiveness and Turnout in State Election Contests […]
LikeLike